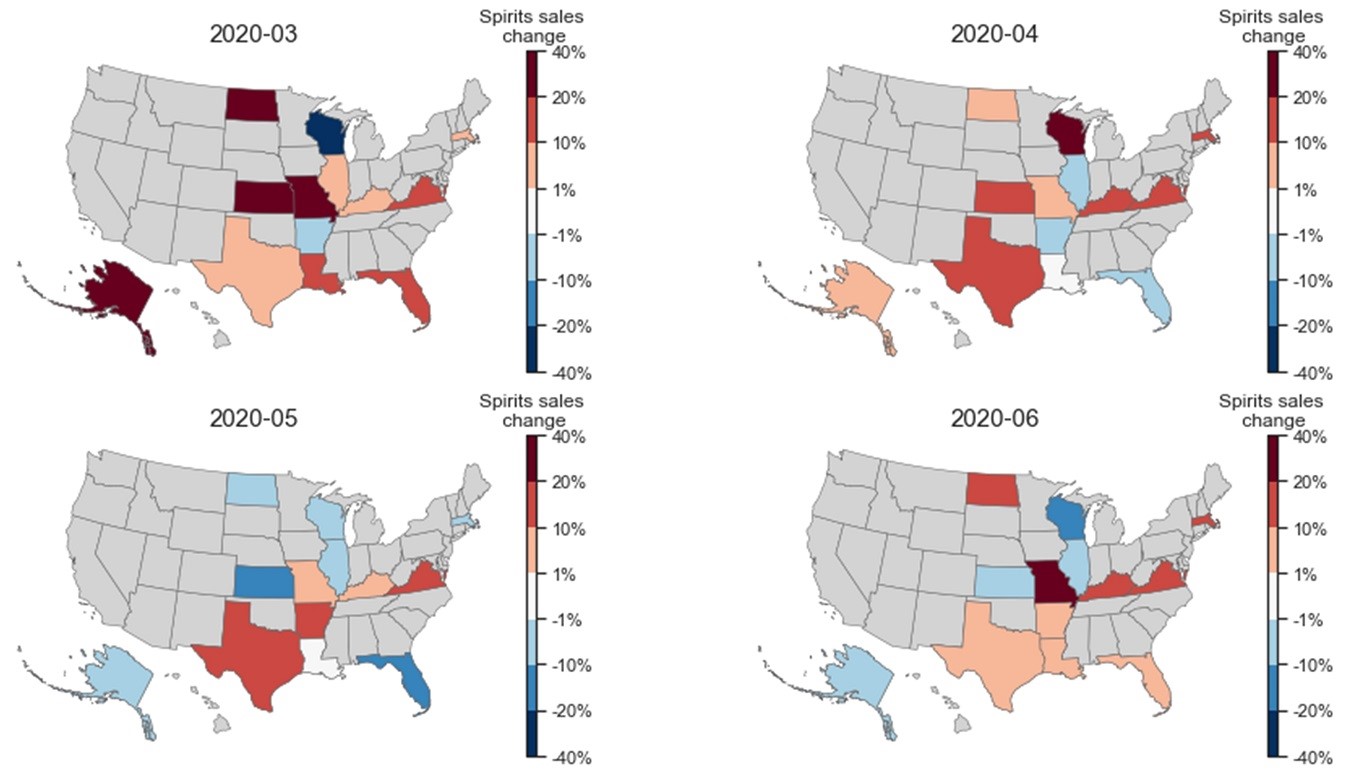
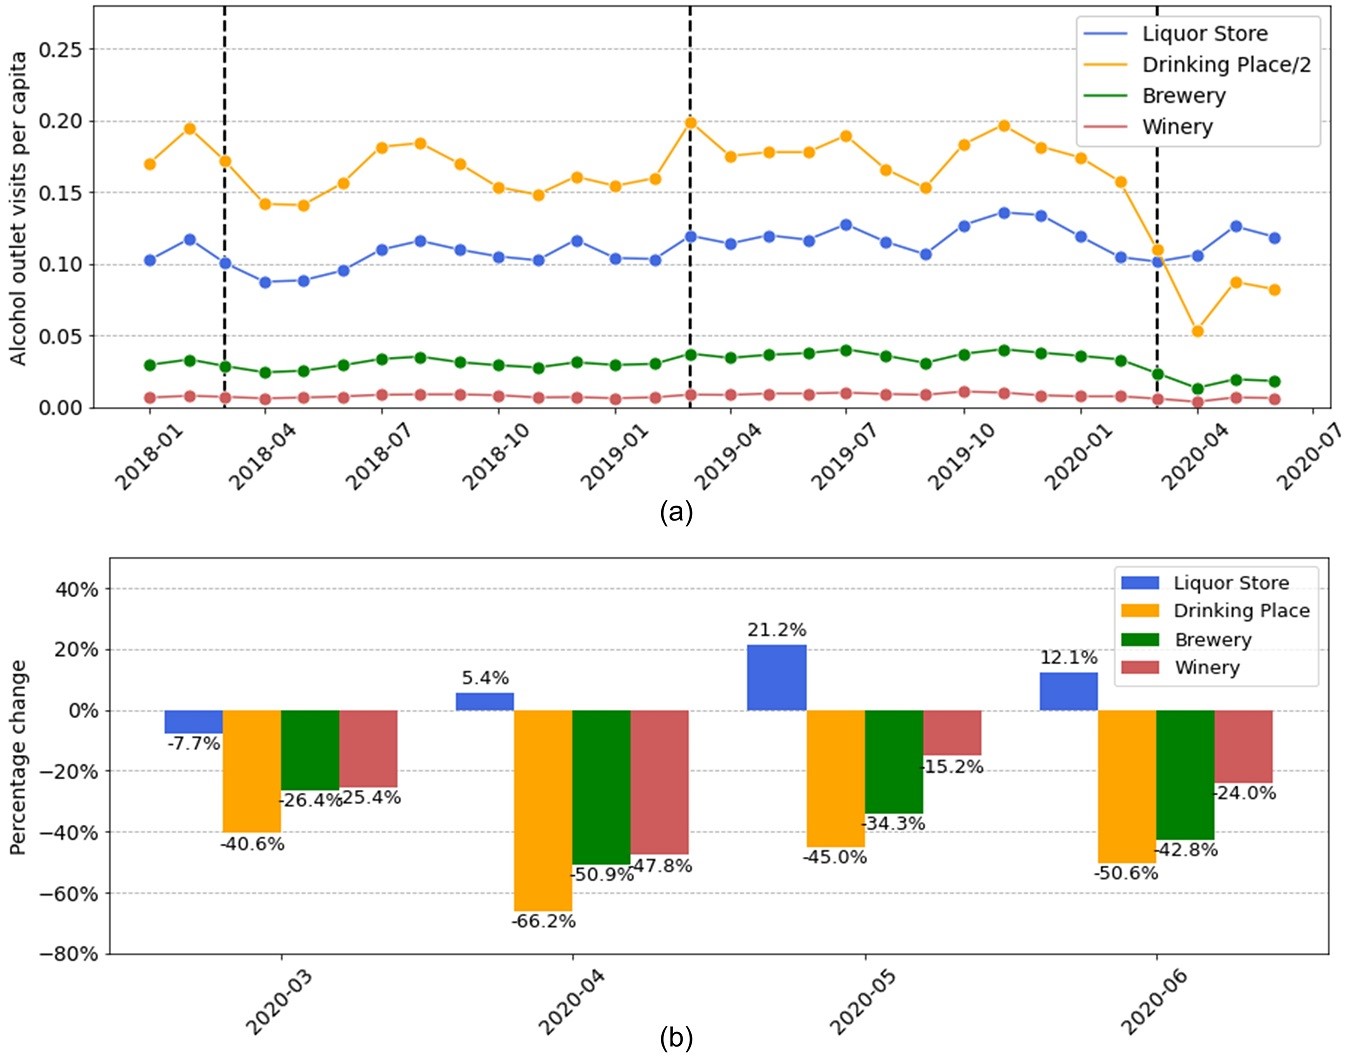
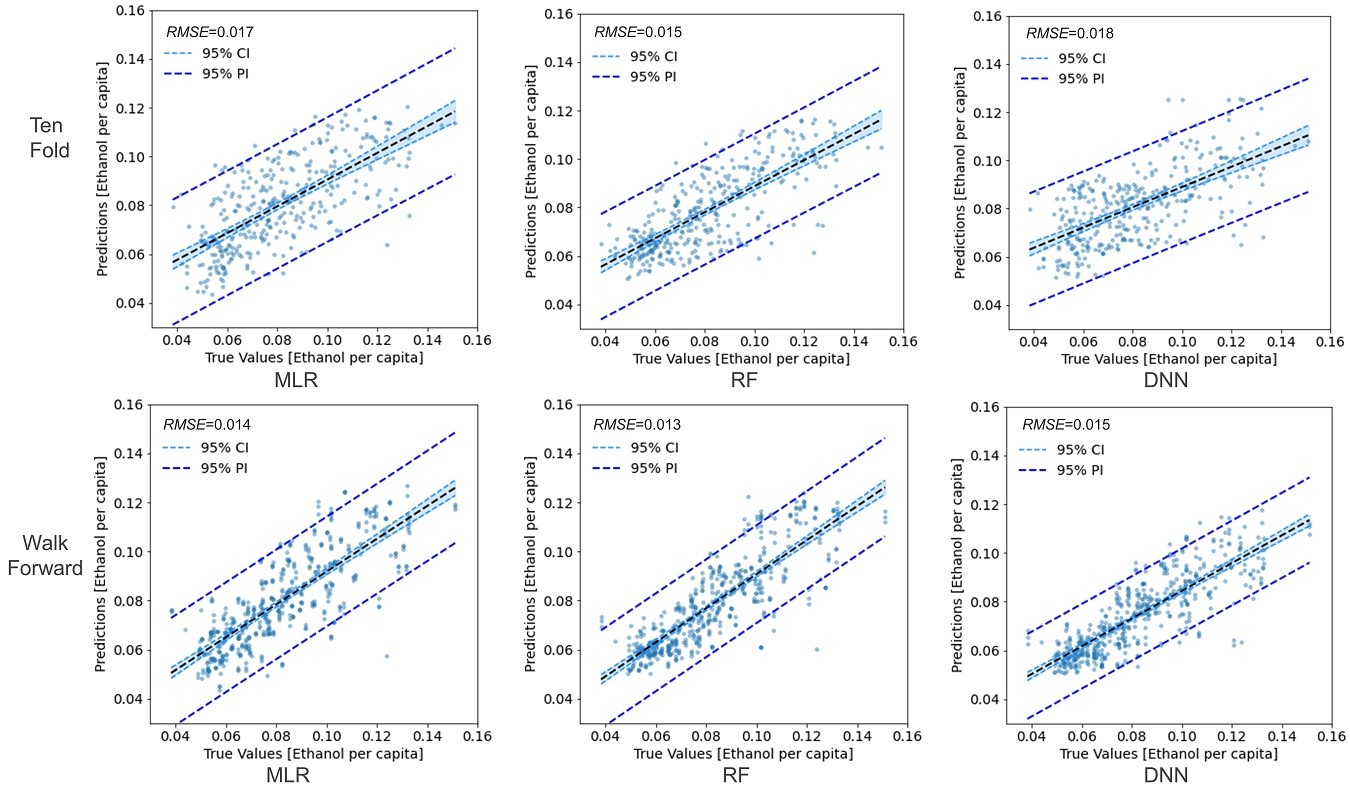
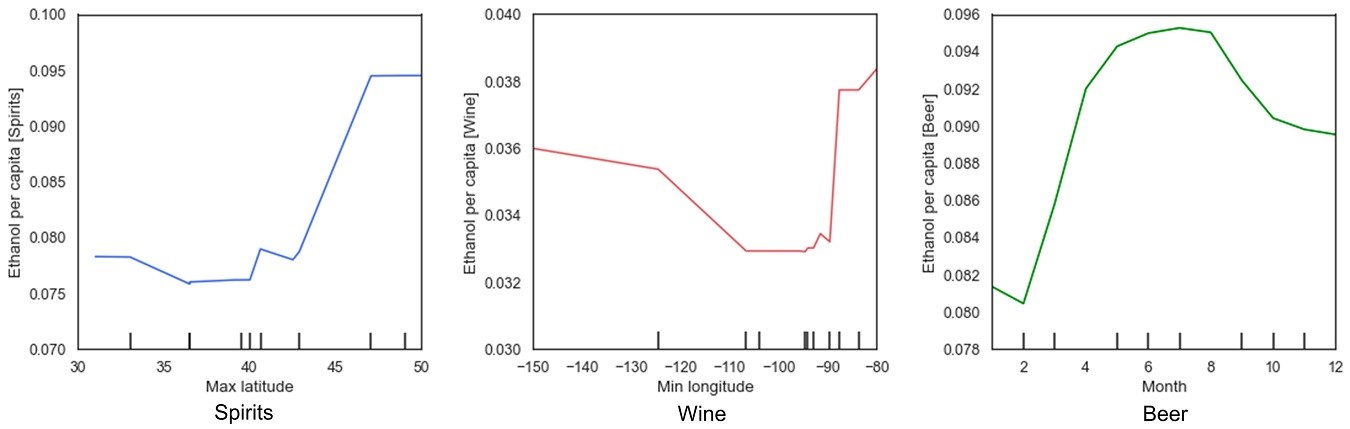
As many U.S. states implemented stay-at-home orders beginning in March 2020, anecdotes reported a surge in alcohol sales, raising concerns about increased alcohol use and associated ills. The surveillance report from the U.S. National Institute on Alcohol Abuse and Alcoholism provides data about the monthly alcohol sales in a subset of states, allowing an investigation of this potential increase in alcohol use. Meanwhile, anonymized human mobility data released by companies such as SafeGraph enables an examination of the visiting behavior of people to various alcohol outlets such as bars and liquor stores. Leveraging these novel datasets, this study examines changes to alcohol sales and alcohol outlet visits during COVID-19 and their geographic differences in a subset of U.S. states. We find major increases in the sales of spirits and wine since March 2020, while the sales of beer decreased. We also find moderate increases in people’s visits to liquor stores, while their visits to bars and pubs substantially decreased. Noticing a significant correlation between alcohol sales and outlet visits, we use machine learning models to examine how that relation changed in the early months of COVID-19 and find evidence in some states for likely panic buying of spirits and wine. Large geographic differences exist across the examined states, with both major increases and decreases in alcohol sales and alcohol outlet visits.
More details are available in the full paper at:
Yingjie Hu, Brian Quigley, and Dane Taylor (2021): Human mobility data and machine learning reveal geographic differences in alcohol sales and alcohol outlet visits across US states during COVID-19. PlOS ONE, 16(12), p.e0255757. [PDF]
This work was also covered in a number of media reports, including:
- CNN: We really did buy more alcohol during the early pandemic, study finds
- NPR-WBFO: UB study of 16 states confirms, yup, we drank a lot more last year
- Miami Herald: Americans stocked up on alcohol early during COVID, study finds. What did they buy?
- LMTOnline: Study shows COVID-19 impact on booze habits, TX bought more beer
- Thrillist: Americans Did Indeed Buy More Alcohol During the Pandemic
- New Medical: UB researchers analyze pandemic-related shifts in alcohol sales across 16 U.S. states